After two years of alpha- and beta-testing, we are glad to announce the official release of FishResp!
We tried to make FishResp suitable for every researcher interested in the analysis of raw respirometry data. Are you a fan of console or a graphical user interface? Do you work with fancy commercial respirometry systems or with your own DIY setup? Do you rely on this or that experimental design/methodological approach?
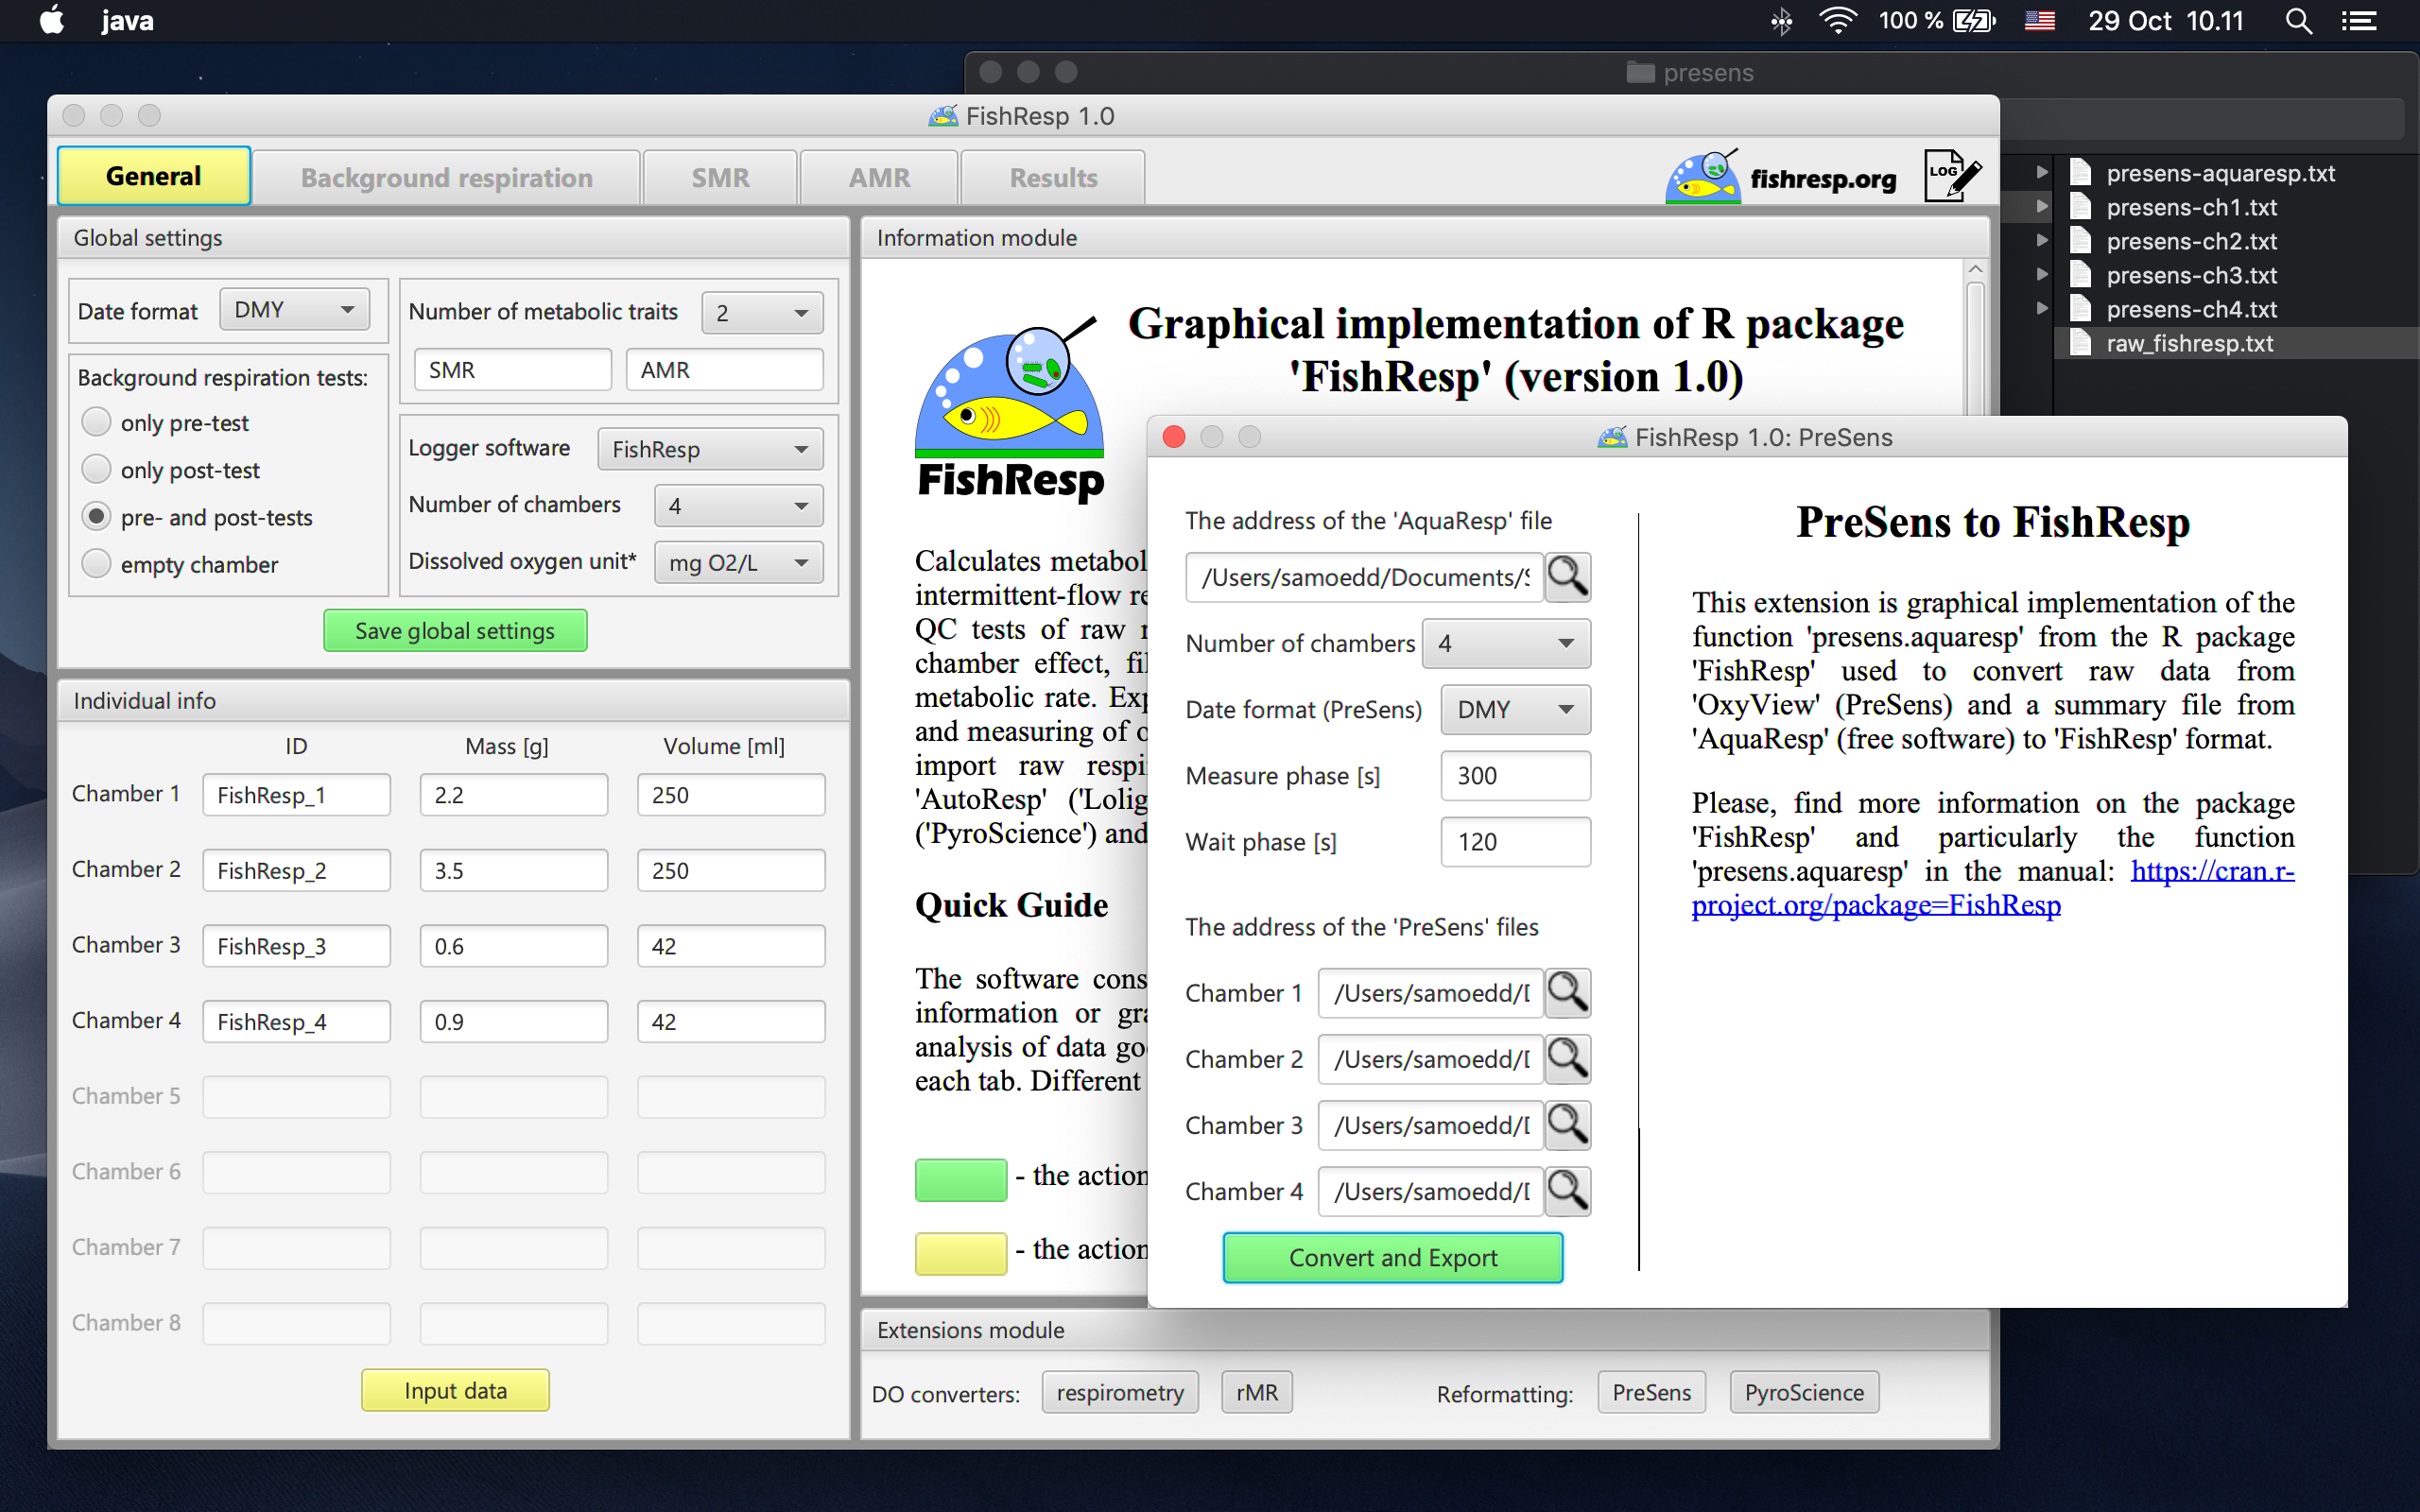
To suit all your needs, we developed both an R package and a cross-platform GUI application which are integrated with the majority of respirometry systems and have wide range of options for analyses of respirometry data. The preprint describing the software will be available in November 2018.
Integration with the majority of respirometry systems
Now, the software is able to import raw data from various intermittent-flow respirometry systems available in the market. Particularly, the output can be loaded to FishResp from following oxygen logger software: ‘AutoResp‘ (LoligoSystems); ‘Qbox-Aqua‘ (QubitSystems); ‘OxyView‘ (PreSens) and ‘Pyro Oxygen Logger‘ (PyroScience) used in couple with ‘AquaResp‘ (free software). Raw data obtained from DIY respirometry setups should be converted manually to the ‘FishResp’ format first and then can be loaded to FishResp as well.
This update could not be done without data contribution of Daniel Montgomery, Laura Almodovar-Acevedo and Stephen White. Thank for making FishResp better!

Diagnostic plots for linear regression analysis
The other important feature of the officially released version is implementation of diagnostic plots for linear regression analysis. Three types of diagnostic plots are available for both current and alternative lengths of selected slopes: “Residuals vs Fitted”, “Normal Q-Q”, “Scale-Location”. In addition, a user is able to remove poor-quality measurement phase(s) manually in the GUI application for specific trait and respirometry chamber.

List of other updates:
• New functions presens.aquaresp and pyroscience.aquaresp convert raw data obtained from ‘OxyView’ and ‘Pyro Oxygen Logger’ logger software to the ‘FishResp’ format.
• ‘Qbox-Aqua’ is a new logger software implemented in the functions import.test and import.meas
• Optional increase of the wait phase (’W’) is available in the functions import.test and import.meas if the wait phase is absent or not long enough to eliminate non-linear change in DO concentration over time from the measurement phase (’M’) after shutting off water supply from the ambient water source.
• Implementation of diagnostic plots for linear regression analysis was added to the function QC.slope: “Residuals vs Fitted”, “Normal Q-Q”, “Scale-Location” for both current and alternative lengths of selected slopes.
• The new function rm.data removes manually measurement phases (’M’) which did not pass QC tests. For the GUI application, a new pop-up window has been developed for removing measurement phases (the button ‘Remove Data’).
• Improved graphics with new labels on axes and in legends
• The bug with time conversion units is fixed, several minor bugs have been fixed in GUI application
• Updated demo data and documentation of the R package

