Category Archives: News

Home / Archive by category "News"

FishResp paper is published in Conservation Physiology!

The manuscript describing the FishResp software has been published in the “Conservation Physiology” journal! This methodological paper is based on two case studies demonstrating functionality and applicability of both the R package and the GUI app. If you use the FishResp software in your research, please cite it as: 

Morozov, S., McCairns, R.J.S., Merila, J. (2019) FishResp: R package and GUI application for analysis of aquatic respirometry data. Conserv Physiol 7(1): coz003; https://doi.org/10.1093/conphys/coz003

We thank the Editor and Anonymous Reviewers of Conservation Physiology for their valuable comments and opportunity to publish our work in such a great journal! We are grateful to all the people who have contributed to the development of this software! We appreciate the financial support of this project from the grant foundations. This work won’t be realised without all of you!

FishResp, version 1.0: official release!

After two years of alpha- and beta-testing, we are glad to announce the official release of FishResp!

We tried to make FishResp suitable for every researcher interested in the analysis of raw respirometry data. Are you a fan of console or a graphical user interface? Do you work with fancy commercial respirometry systems or with your own DIY setup? Do you rely on this or that experimental design/methodological approach?

To suit all your needs, we developed both an R package and a cross-platform GUI application which are integrated with the majority of respirometry systems and have wide range of options for analyses of respirometry data. The preprint describing the software will be available in November 2018.

Integration with the majority of respirometry systems

Now, the software is able to import raw data from various intermittent-flow respirometry systems available in the market. Particularly, the output can be loaded to FishResp from following oxygen logger software: ‘AutoResp‘ (LoligoSystems); ‘Qbox-Aqua‘ (QubitSystems); ‘OxyView‘ (PreSens) and ‘Pyro Oxygen Logger‘ (PyroScience) used in couple with ‘AquaResp‘ (free software). Raw data obtained from DIY respirometry setups should be converted manually to the ‘FishResp’ format first and then can be loaded to FishResp as well.

This update could not be done without data contribution of Daniel MontgomeryLaura Almodovar-Acevedo and Stephen White. Thank for making FishResp better!


Diagnostic plots for linear regression analysis

The other important feature of the officially released version is implementation of diagnostic plots for linear regression analysis. Three types of diagnostic plots are available for both current and alternative lengths of selected slopes: “Residuals vs Fitted”, “Normal Q-Q”, “Scale-Location”. In addition, a user is able to remove poor-quality measurement phase(s) manually in the GUI application for specific trait and respirometry chamber.


List of other updates:

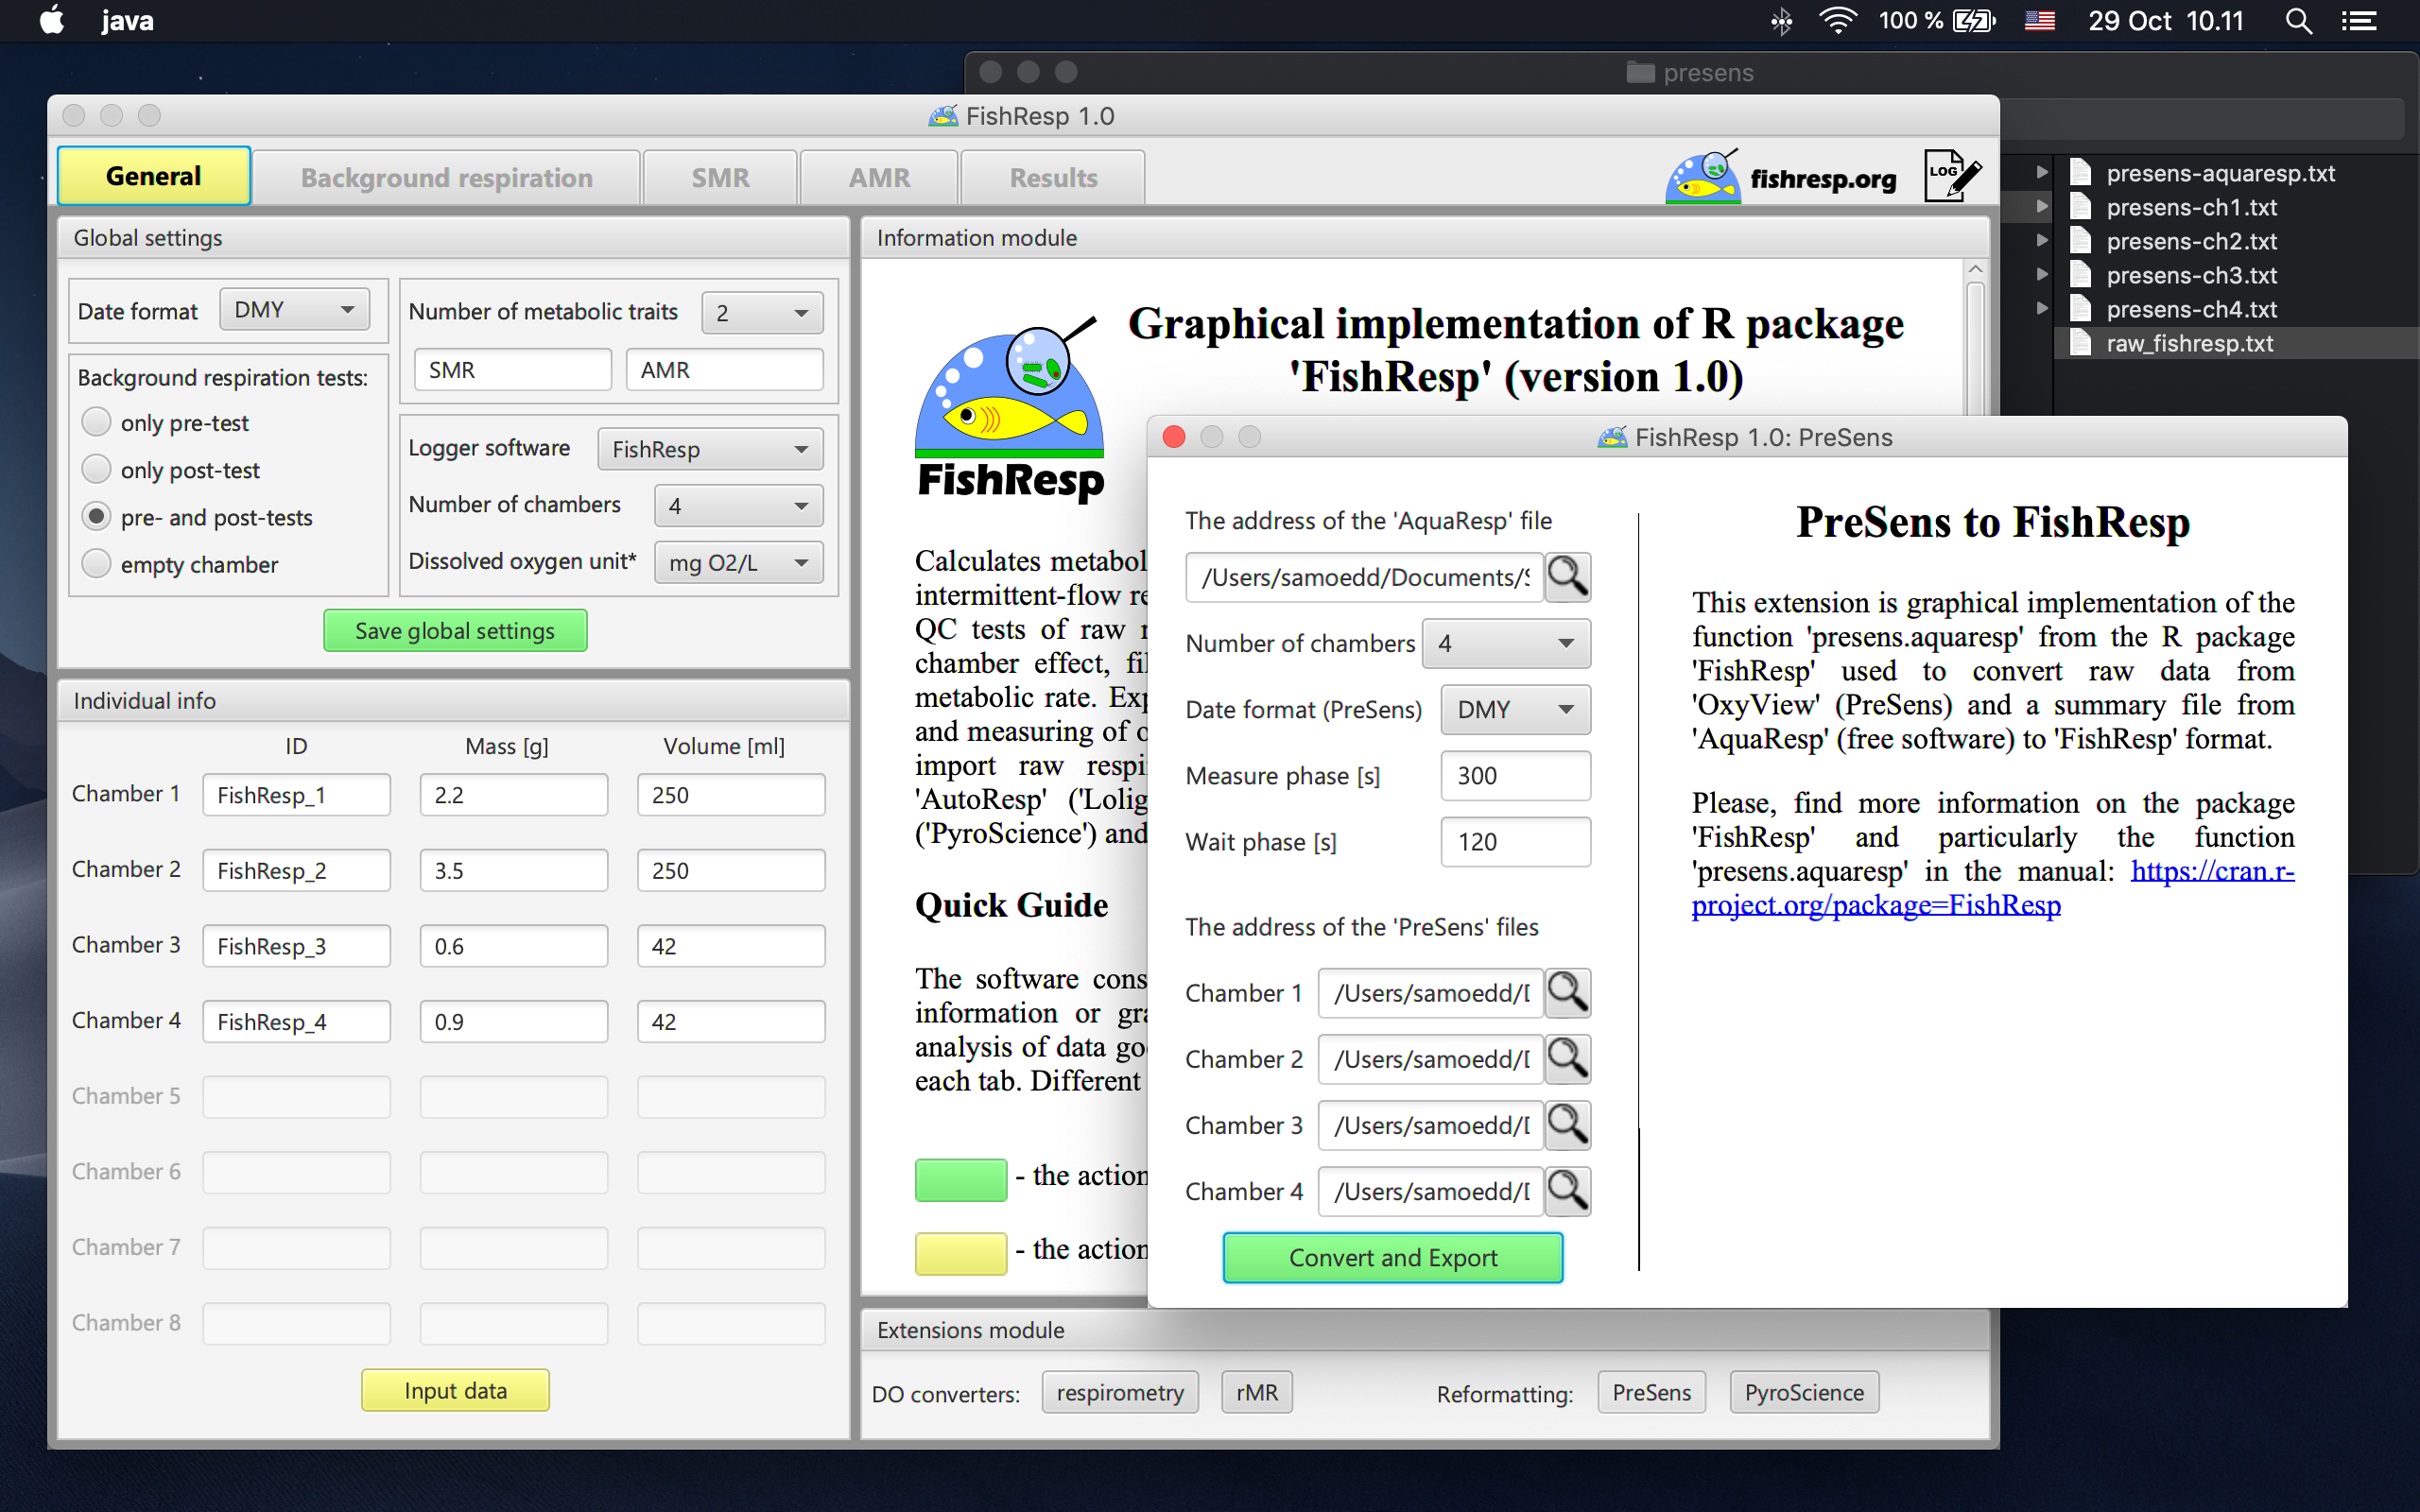
• New functions presens.aquaresp and pyroscience.aquaresp convert raw data obtained from ‘OxyView’ and ‘Pyro Oxygen Logger’ logger software to the ‘FishResp’ format.

• ‘Qbox-Aqua’ is a new logger software implemented in the functions import.test and import.meas

• Optional increase of the wait phase (’W’) is available in the functions import.test and import.meas if the wait phase is absent or not long enough to eliminate non-linear change in DO concentration over time from the measurement phase (’M’) after shutting off water supply from the ambient water source.

• Implementation of diagnostic plots for linear regression analysis was added to the function QC.slope: “Residuals vs Fitted”, “Normal Q-Q”, “Scale-Location” for both current and alternative lengths of selected slopes.

• The new function rm.data removes manually measurement phases (’M’) which did not pass QC tests. For the GUI application, a new pop-up window has been developed for removing measurement phases (the button ‘Remove Data’).

• Improved graphics with new labels on axes and in legends

• The bug with time conversion units is fixed, several minor bugs have been fixed in GUI application

• Updated demo data and documentation of the R package


Important information before official release!

A serious bug has been found in the source code which should be taken into account by all users worked with previous versions of FishResp (i.e. 0.1; 0.2; 0.3; 0.4).  Specifically, the function calculate.MR converted incorrectly time units from seconds to hours which led to 3.6-fold underestimation of absolute and mass-specific metabolic rate. To fix wrong calculation of metabolic rate estimates, please multiply them by 3.6 times in the final dataset (excluding factorial metabolic scope and background respiration).

We thank Nicholas Carey, the developer of the R-package ‘respR‘, for comparing outputs of our packages and detecting this bug. Now, both ‘respR’ and FishResp show identical results with the same input data. We are also grateful to people who have found missing information in package documentation or minor bugs in the code over the last two years. All of them are fixed: source code, documentation and demo-data have been updated in the version 1.0.1.

Beta testing is over. The official release of the ‘FishResp’ software will be announced in October 2018.

FishResp, version 0.3.0: colours matter

As 8% of male population and around 0.4% of female population have some type of colour blindness, we decided to test both GUI application and graphs produced by the R package via colour the blindness simulators  “Sim Daltonism” and “Color Oracle”. As a result, some colour changes have been implemented to the code in the R package, while the graphical interface has not been changed due to distinctive hues of different functional buttons (see the screenshot). We thank the anonymous reviewer of our manuscript devoted to the FishResp software for sharing this idea.

Major updates

•  ability to import datasets with columns containing only NA or NaN values
•  ability to import raw data with both decimal separators: “.” and “,”

Minor updates

•  line “now” has been changed from green to red, while line “alter” has been changed from red to black in the function QC.slope
•  words “now” and “alter” have been replaced by actual length of slopes (in sec) in the legend of the figure produced by the function QC.slope
•  parameter “Weight” has been changed to “Mass” in the function input.info
•  parameter “q” has been changed to “p” in the function extract.slope
•  default value for the parameter “r2” in the function extract.slope has been changed from 0.9 to 0.95
•  the bug with warnings occurred in the function extract.slope has been fixed

‘FishResp’, version 0.2.0: stability and flexibility

Both the R package and its GUI implementation were upgraded to the version 0.2.0. New options for import, correction and calculation of respirometry data suppose to make ‘FishResp’ a more flexible tool than before. In addition, several bugs and technical problems were revealed and fixed, which should improve the stability of the software. Please, see the list of updates below to get detailed information on the changes applied to the new version of ‘FishResp’.

Major updates

•  seven new methods of slope extraction are integrated into the function extract.slope (including ones described in Chabot et al, 2016*)

•  ‘progressive’ method for correction of background respiration was split into ‘linear’ and ‘exponential’ in the function correct.meas

•  ability to work with different date formats (DMY, MDY and YMD) and time formats (24h, AM/PM)

•  several DO units are acceptable for analyzing respirometry data: mg O2/L, mmol O2/L, ml O2/L

•  two new functions convert.respirometry and convert.rMR were created to convert other DO units to acceptable ones. These functions represents modifications of the functions conv_o2 and DO.unit.convert from the packages ‘respirometry’ and ‘rMR’ packages, respectively.

GUI updates

•  new extensions module for integration with other R packages, scripts and functions

•  graphical interfaces for extensions ‘respirometry’ and ‘rMR’ (only converter functions have been used from those packages)

•  opportunity to create a log file to record commands and error messages on the hard drive

•  design structure is slightly changed due to major updates

•  ‘FishResp’ logo inserted into an empty graphical module

Minor updates

•  renamed the ‘Standard’ oxygen logger format to ‘FishResp’

•  new package dependencies: ‘mclust’, ‘respirometry’,’rMR

•  new trial datasets are used in the R package (see examples there)

•  DO unit is changed automatically in all plots after using the function input.info

•  change point and font sizes in all functions for a better readability of plots

•  legends to plots of the function QC.slopes were added

•  automatic plot was removed from the function extract.slopes

•  initial DO point is changed form 30s to 5s in the function import.test 

•  fixed a bug with plotting >24 slopes in the function QC.slopes

•  fixed a bug in functions import.meas and import.test, when the first Measure Phase is not ‘M1’

        •  fixed a bug in the ‘parallel’ method (now ‘linear’)

References

* Chabot, D., Steffensen, J. F., & Farrell, A. P. (2016). The determination of standard metabolic rate
in fishes. Journal of Fish Biology, 88(1), 81-121.

Beta release of GUI application ‘FishResp’


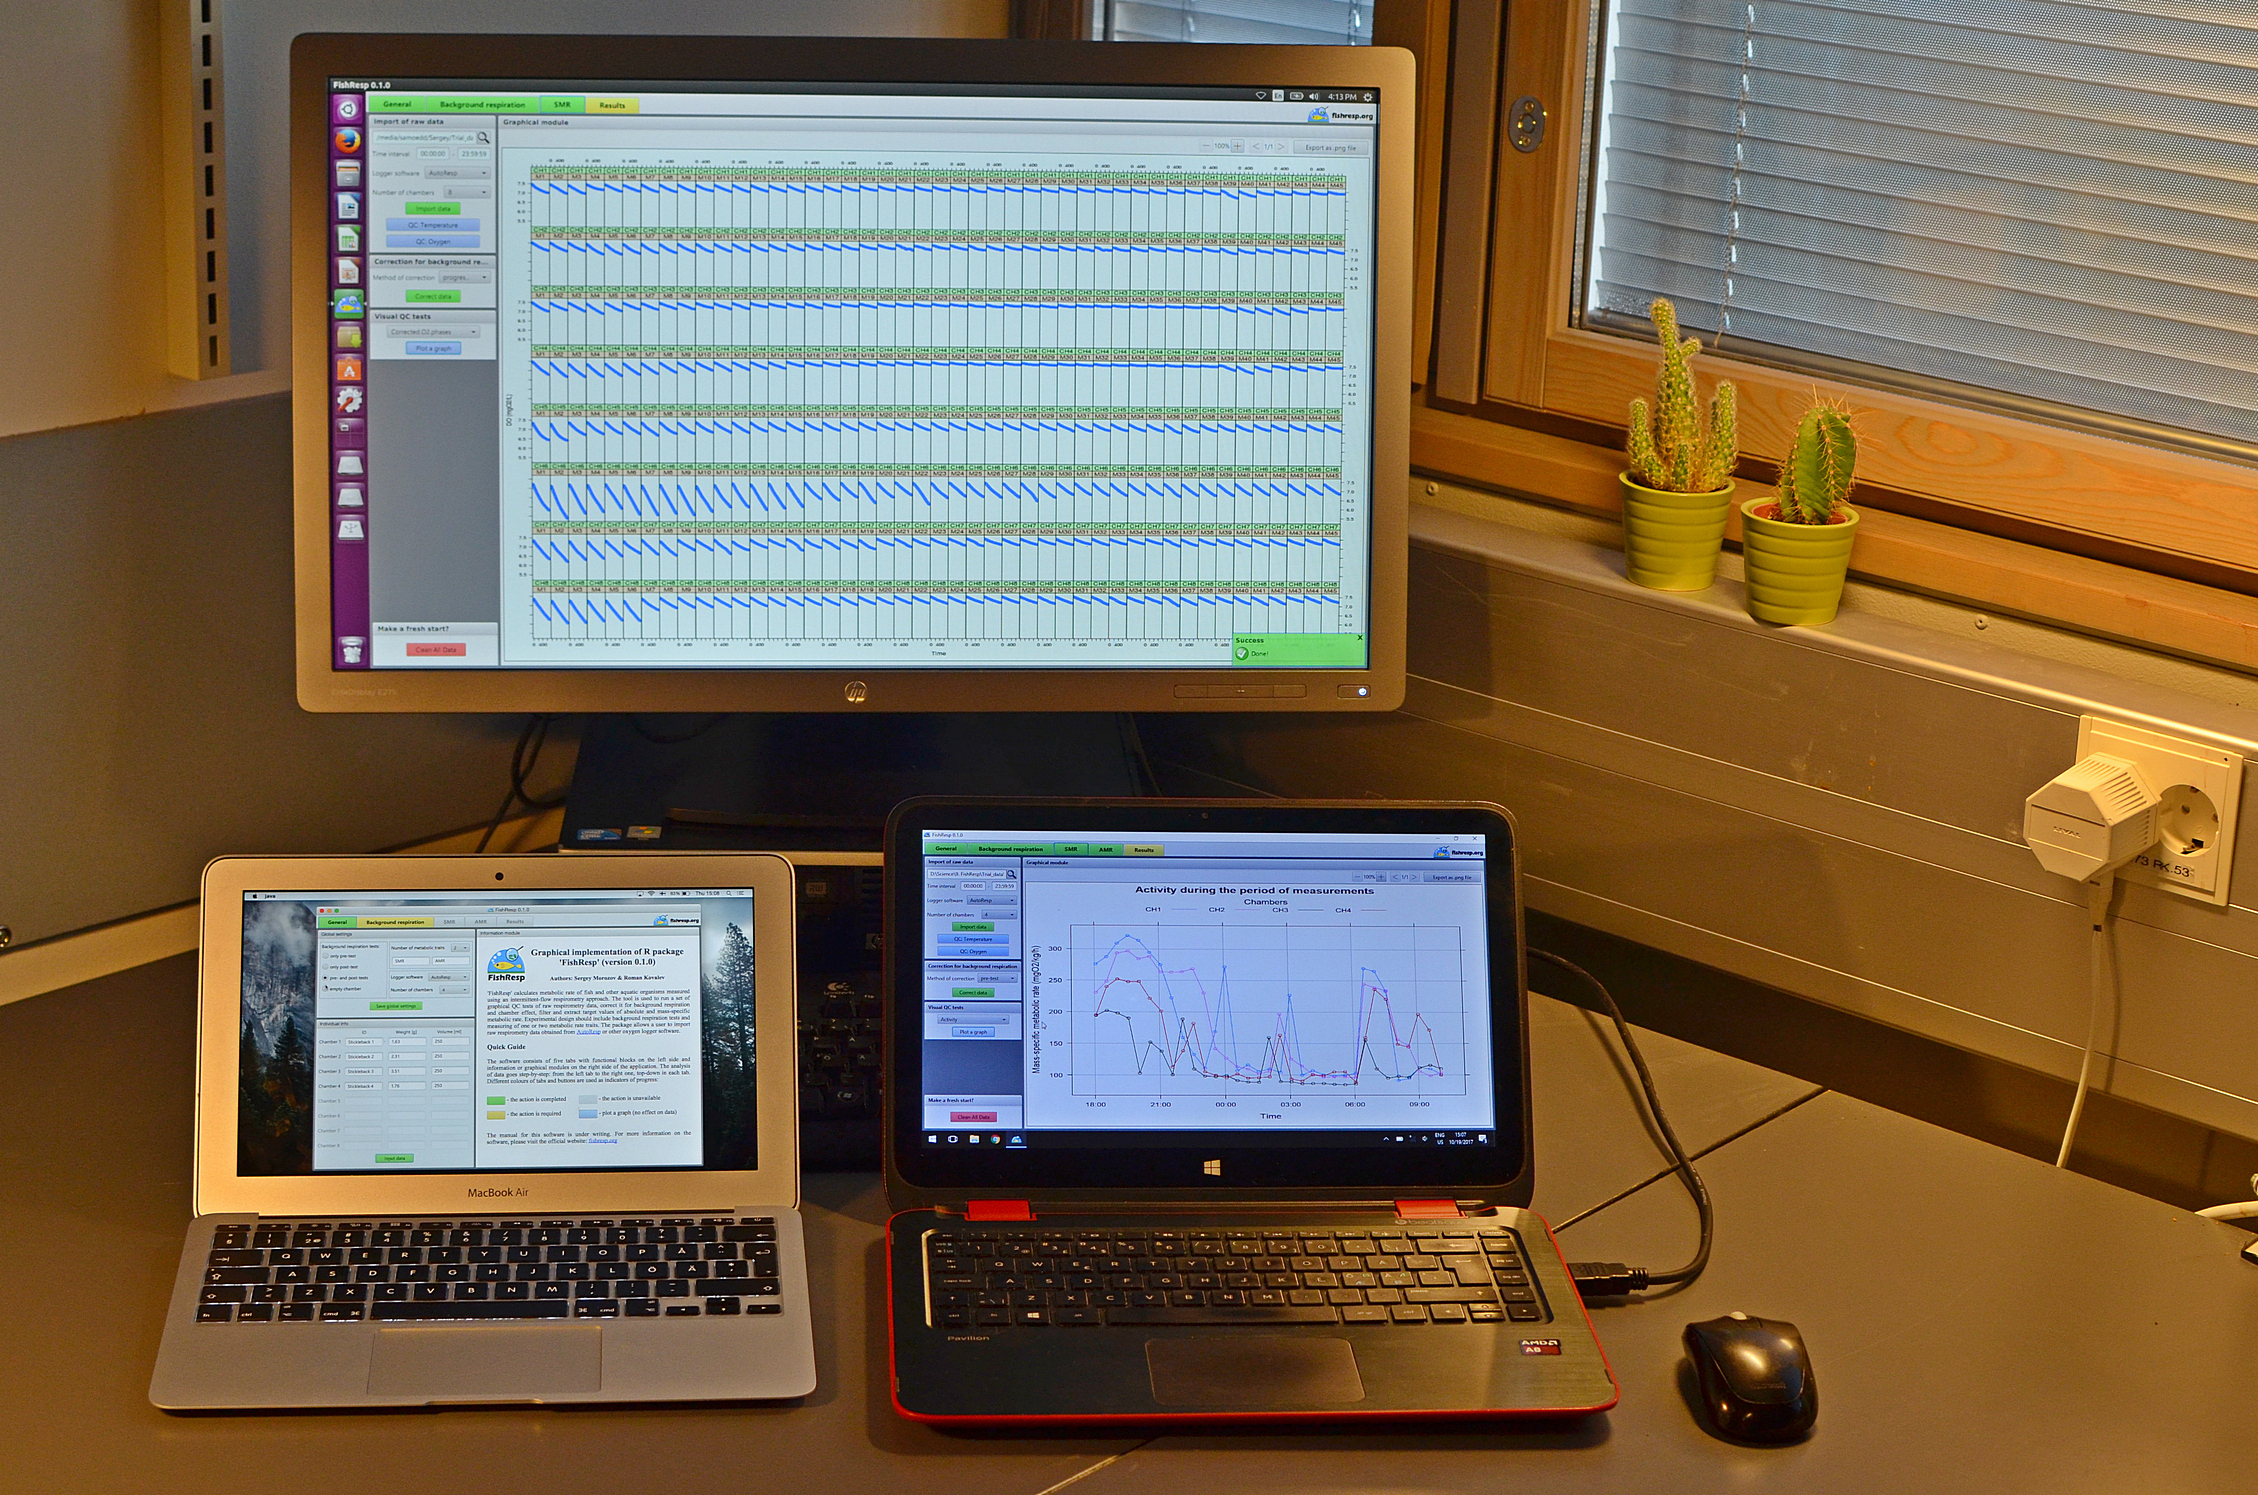
The software represents a graphical implementation of the R package ‘FishResp’. It is a free application with a user-friendly interface available for Windows, Linux and macOS. To know more about the software, please click here.

If you find a bug, please report about it on the forum.
Your feedback is important for us to improve next versions of the GUI software ‘FishResp’.

‘FishResp’ is available on CRAN and GitHub


The R package ‘FishResp’ (version 0.1.0) is available on CRAN and GitHub!

‘FishResp’ in Chicago: Experimental Biology 2017

The R package ‘FishResp’ and its graphical implementation will be presented today (23.04.2017) at the conference “Experimental Biology 2017” in Chicago.

Title of the abstract: “FishResp: an R package for Filtering and Analyzing Raw Data in Aquatic Respirometry“.

× • the poster session starts at 12.45 (poster number: F13)
• the oral presentation will be at 16.00 in hall W192A.

You are welcome!

The first public presentation of ‘FishResp’

Spiring Symposium 2017 – we got a 2nd runner-up award for the project!